AgentOS Scope OutJoin the waitlist
Scope Out crawls PropTech directories, deep-scrapes every product it finds, runs four-dimension AI scoring, and hands you a ranked dossier — mission statement, feature gaps, and competitor weaknesses included. Here is exactly what happens under the hood.
Go to the Crawl page, paste any Kerfuffle.com directory URL, and choose your depth: Skim (seconds, surface data only) or Full Analysis (minutes, everything). The crawler fans out across all paginated listing pages, respects robots.txt and rate limits, and writes every vendor it finds — name, category tags, description, source URL — into the discovered_products table. Duplicate-safe: the same URL won't queue twice.
For each product flagged for deep analysis, an Inngest background job visits its website and Kerfuffle listing page. It pulls star ratings, individual review text, review count, pricing tier signals (free / freemium / £50–200/mo / enterprise), and feature bullet points. Reviews are then classified by sentiment and topic — pricing pain, onboarding friction, missing integrations — feeding the scoring engine.
The AI scoring engine runs four sub-scorers in parallel: Replicability (how quickly your stack can rebuild it), Market Demand (review volume + sentiment), Revenue Potential (pricing tier × PropTech market size), and Competitive Gap (what the worst reviews reveal). Each dimension outputs a 1–10 score with a written rationale. A weighted composite merges them into the single rank that drives the dashboard — weights you can adjust in Settings without re-running AI.
Click any row on the ranked dashboard to open the full dossier: dimension scores with written explanations, raw review samples, an auto-drafted mission statement for a competing SaaS, a 10-item prioritised feature list, and a competitor weakness analysis — all derived from real review data. One-click copy buttons export each artefact as Markdown, ready to paste into your build workflow. Export the whole dossier as PDF or download the full table as CSV.
Scope Out is internal — access is restricted to the team. Questions about the pipeline or data coverage? Email us at sf-core-org-support-agentos-scope-out@saas-factory.ai
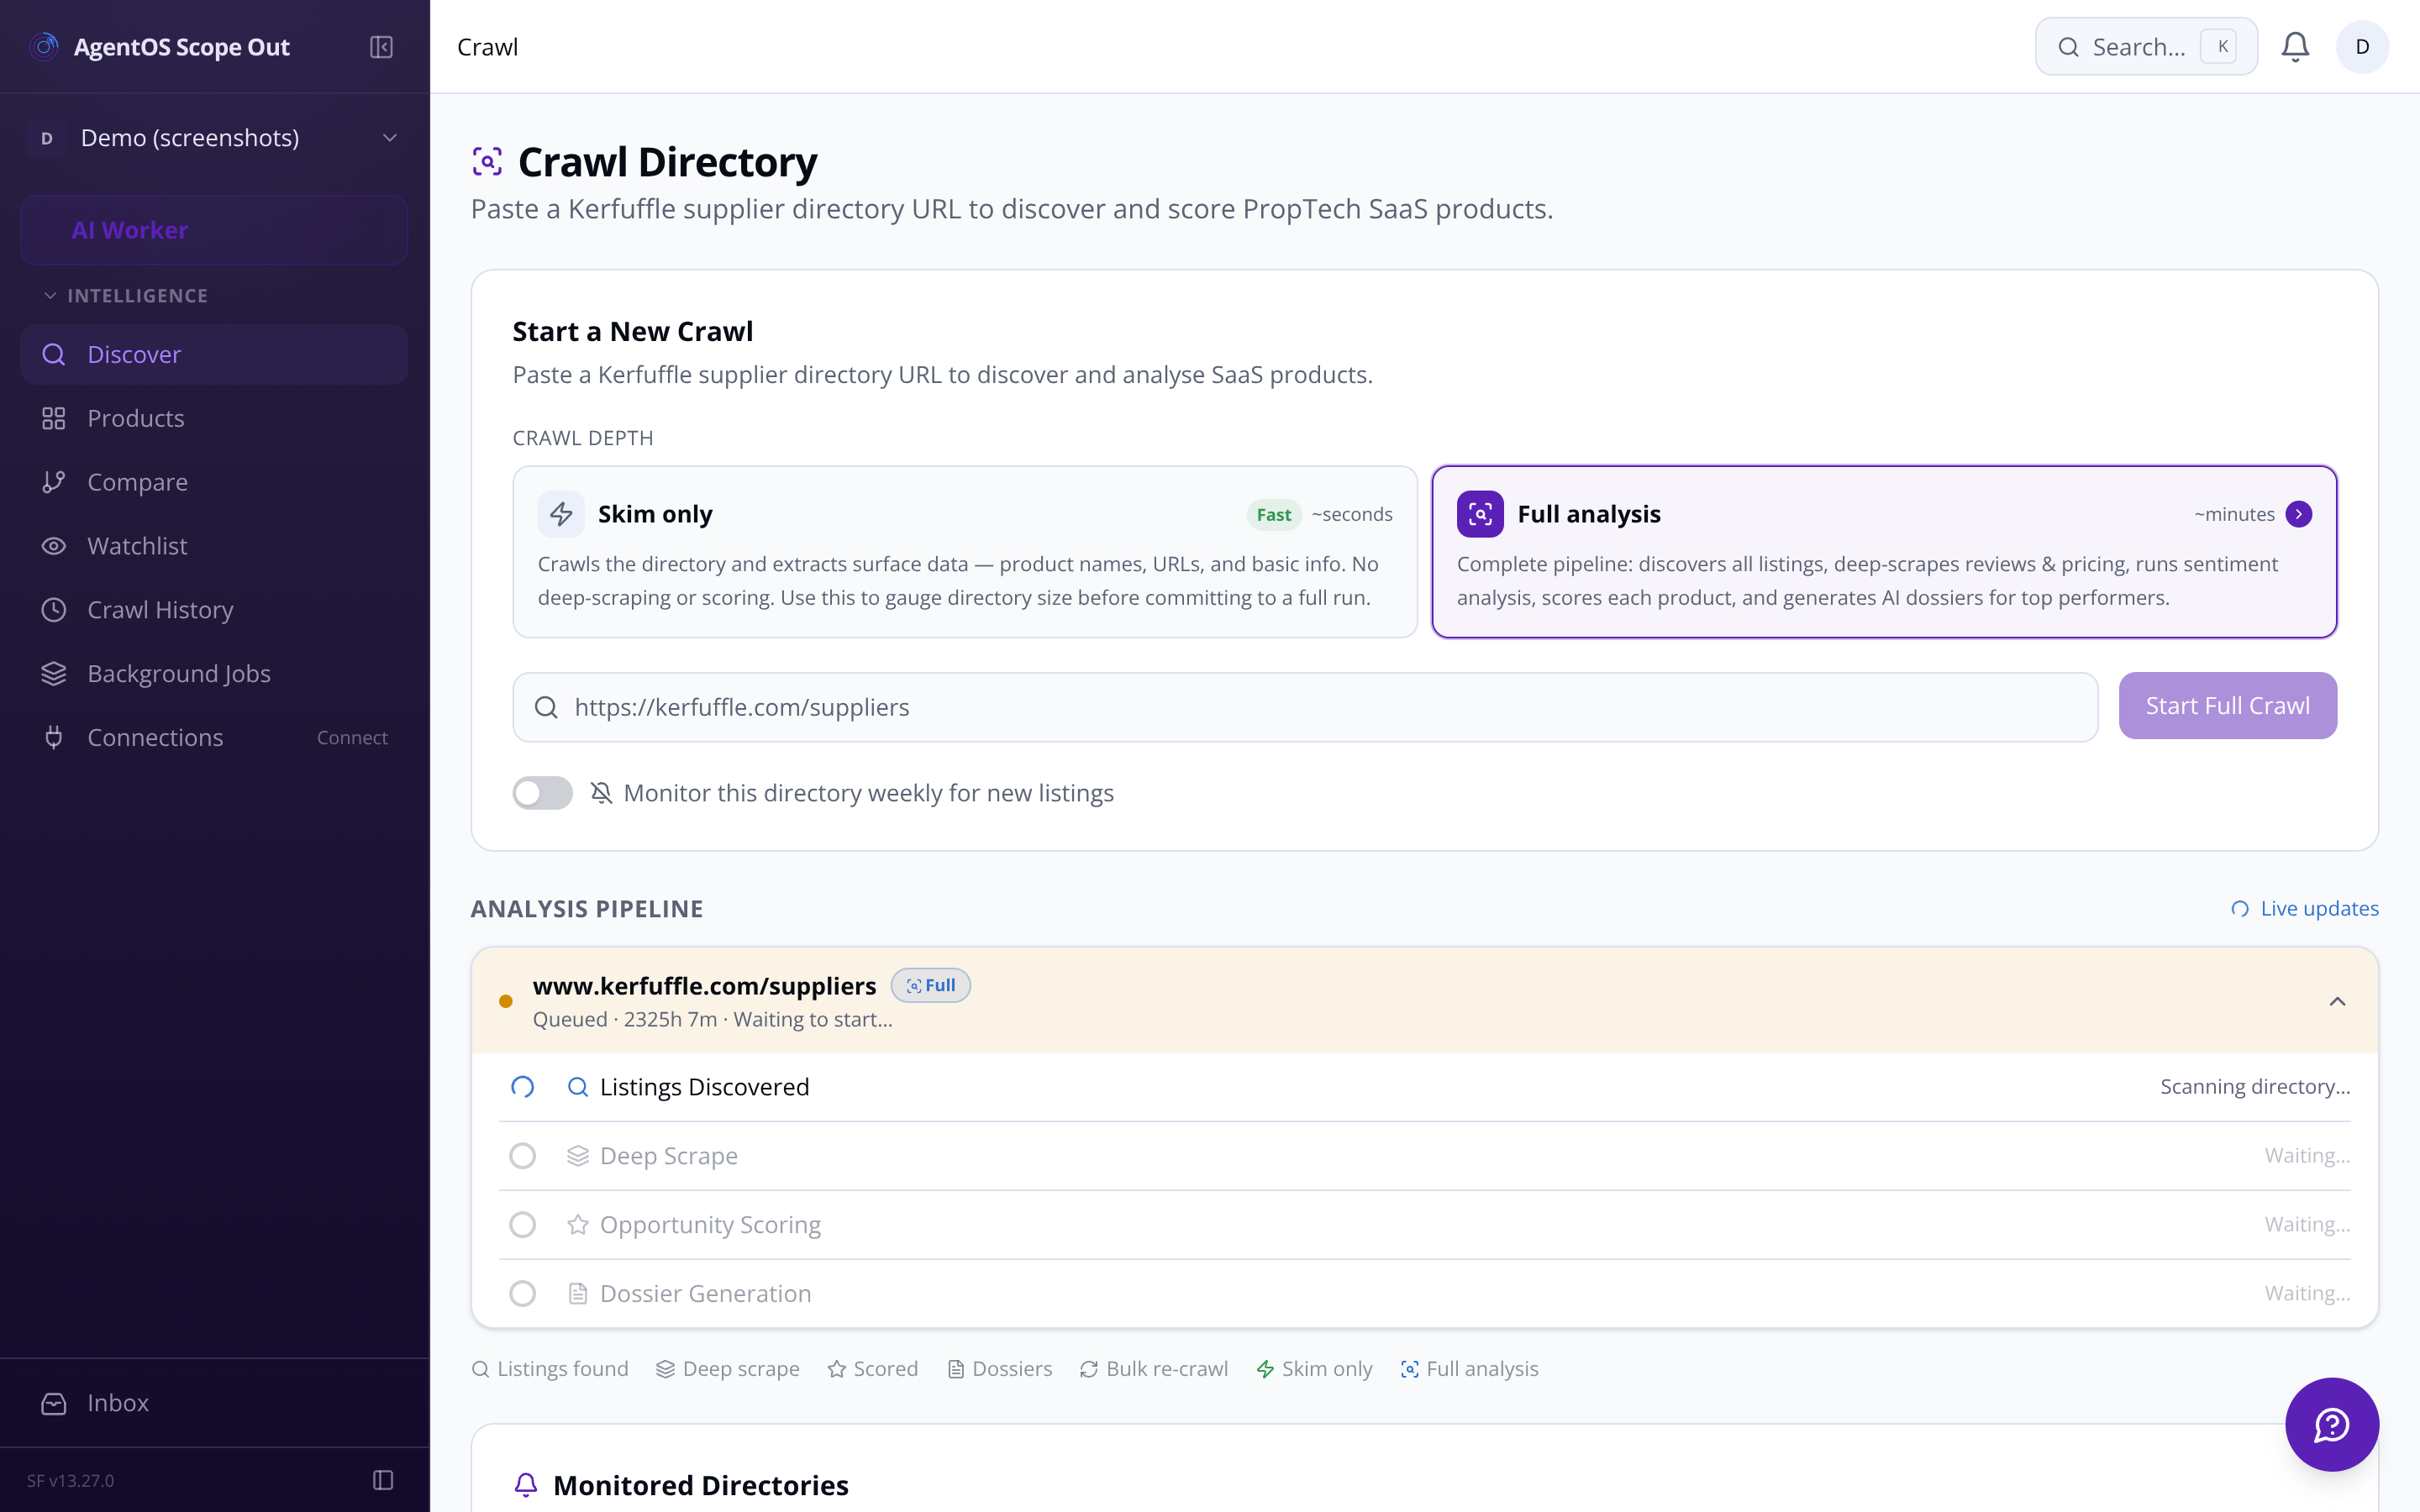
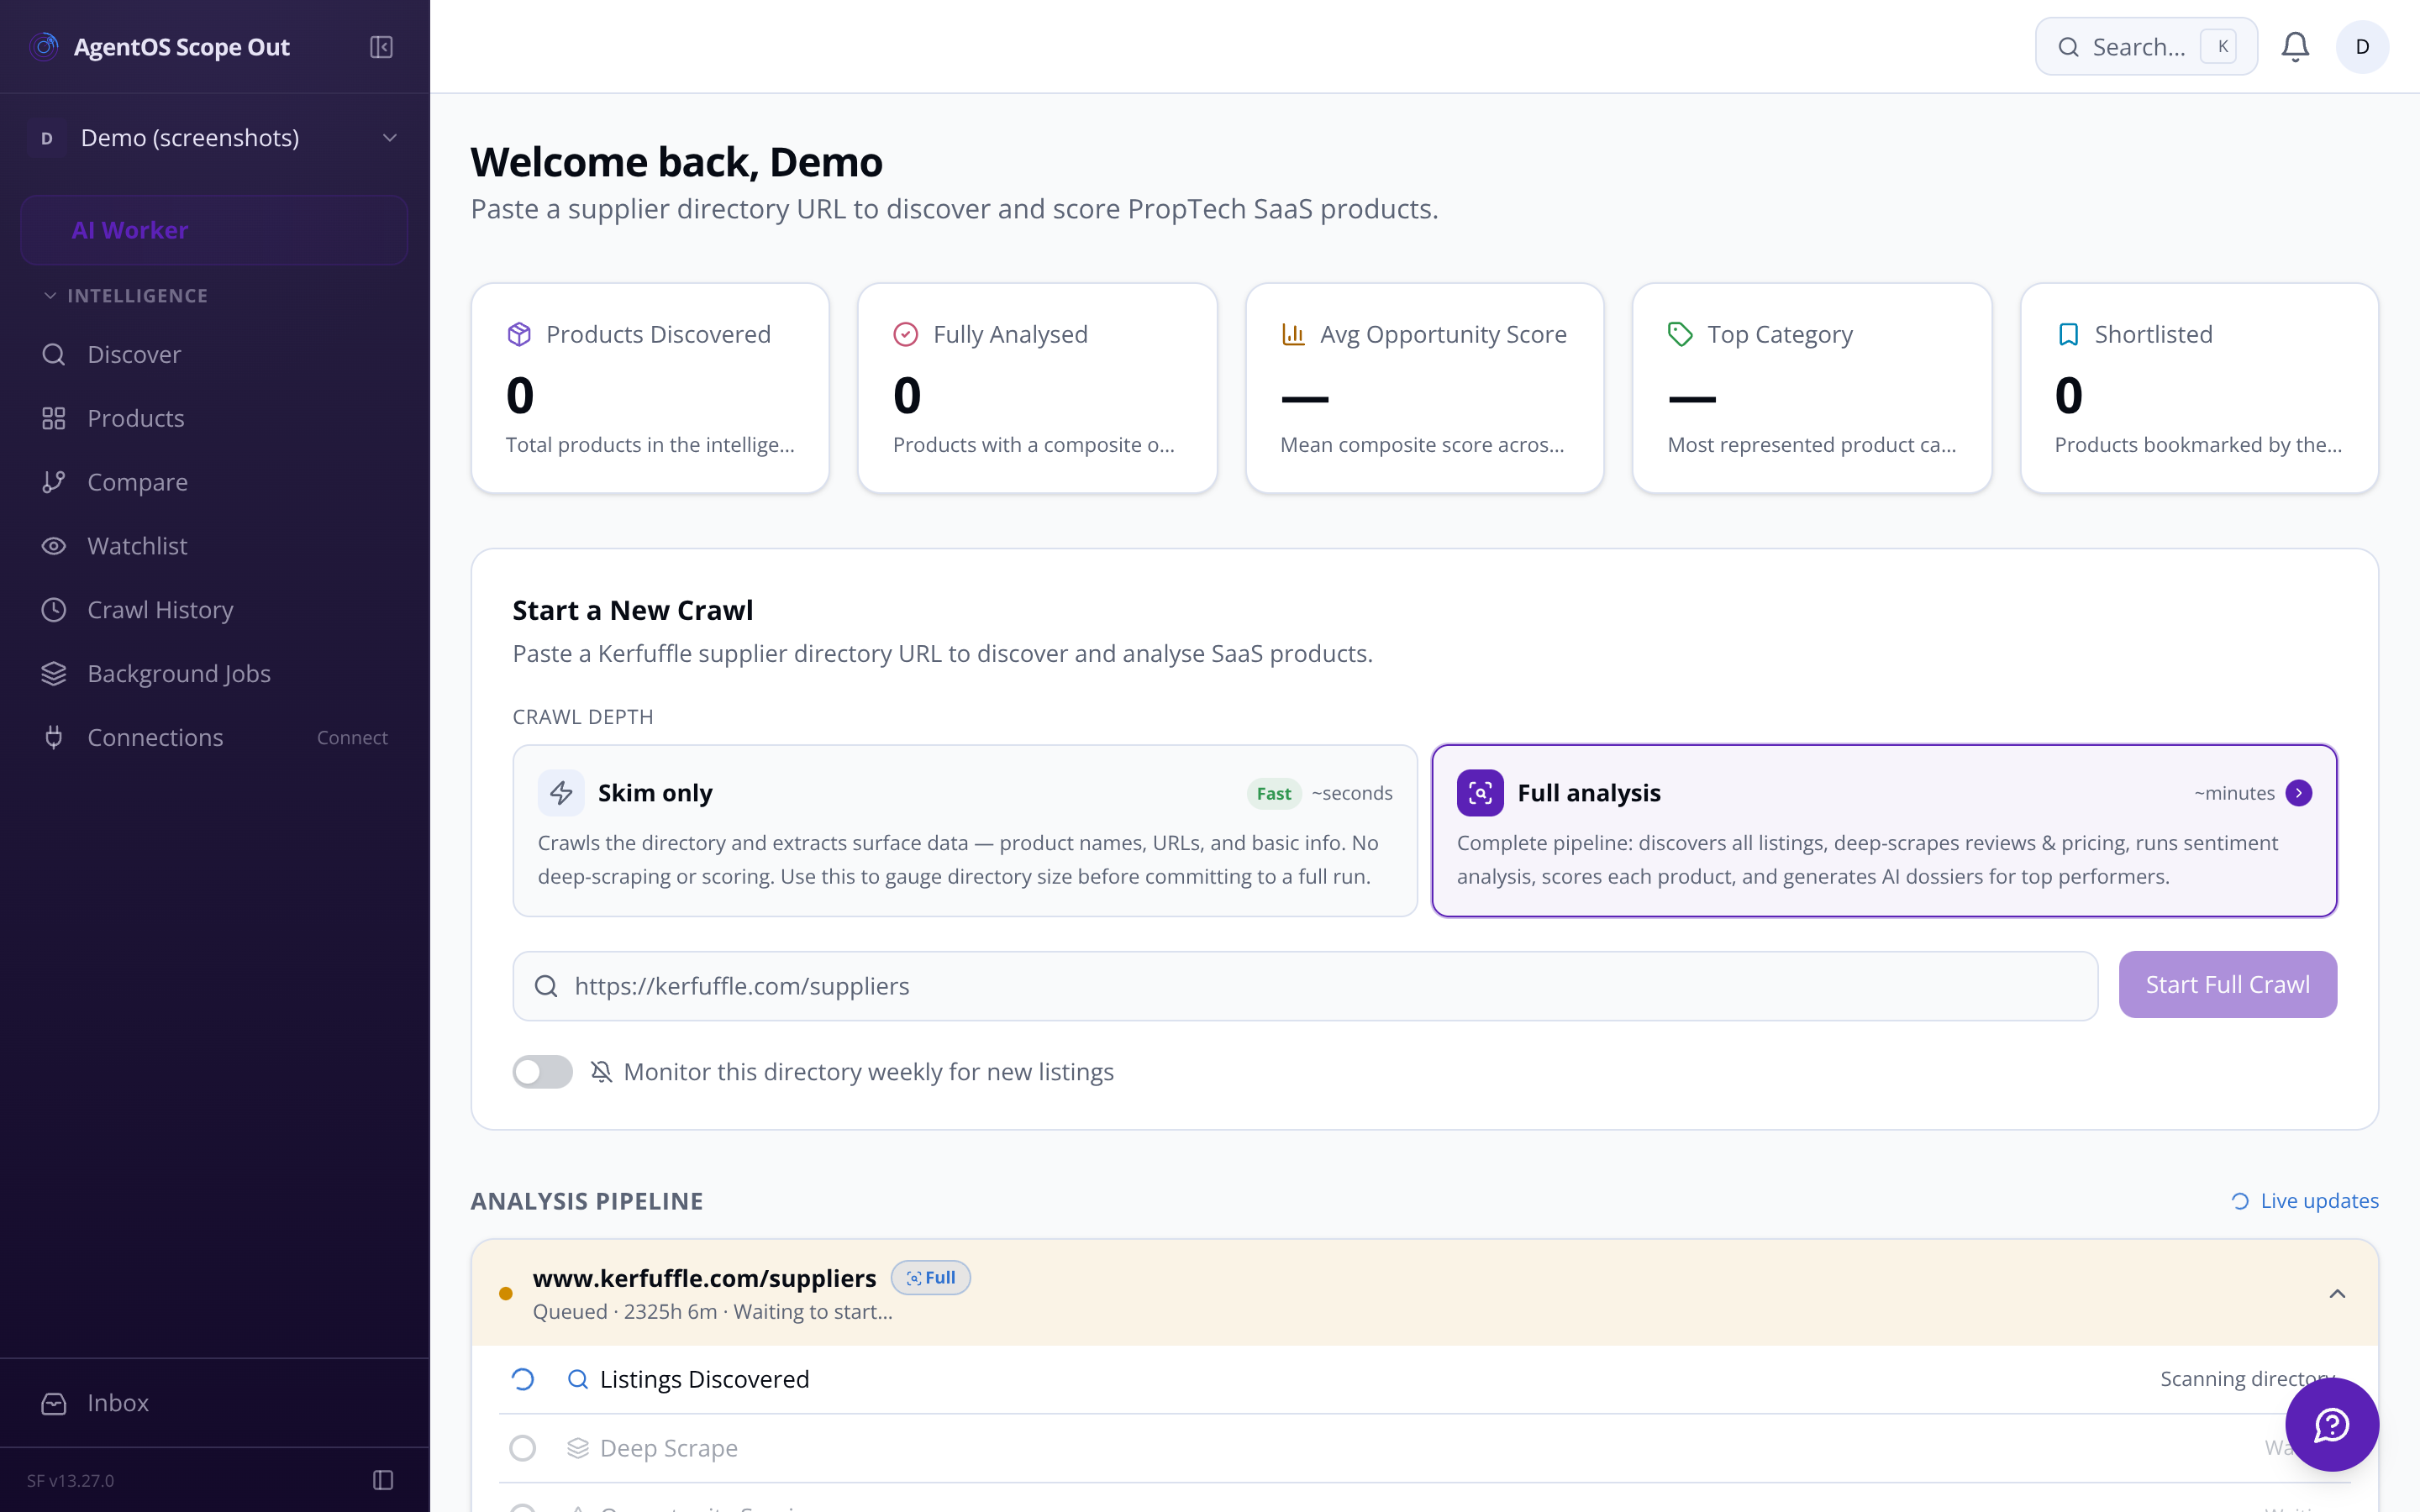
A real-time status panel tracks every stage of the pipeline as it runs. You see listings discovered, products deep-scraped, products scored, and dossiers generated — all live, with counts and percentages.
The ranked products dashboard is built for information density. Every analysed product occupies one row: composite score, replicability, market demand, revenue potential, competitive gap score, review count, pricing tier, and crawl date — all sortable.
Filter by category or pricing tier Multi-select filters and a full-text search work across product names, descriptions, and dossier content.
Track movement between runs Score changes above 1.5 points show a directional ▲ / ▼ indicator so you spot rising opportunities immediately.
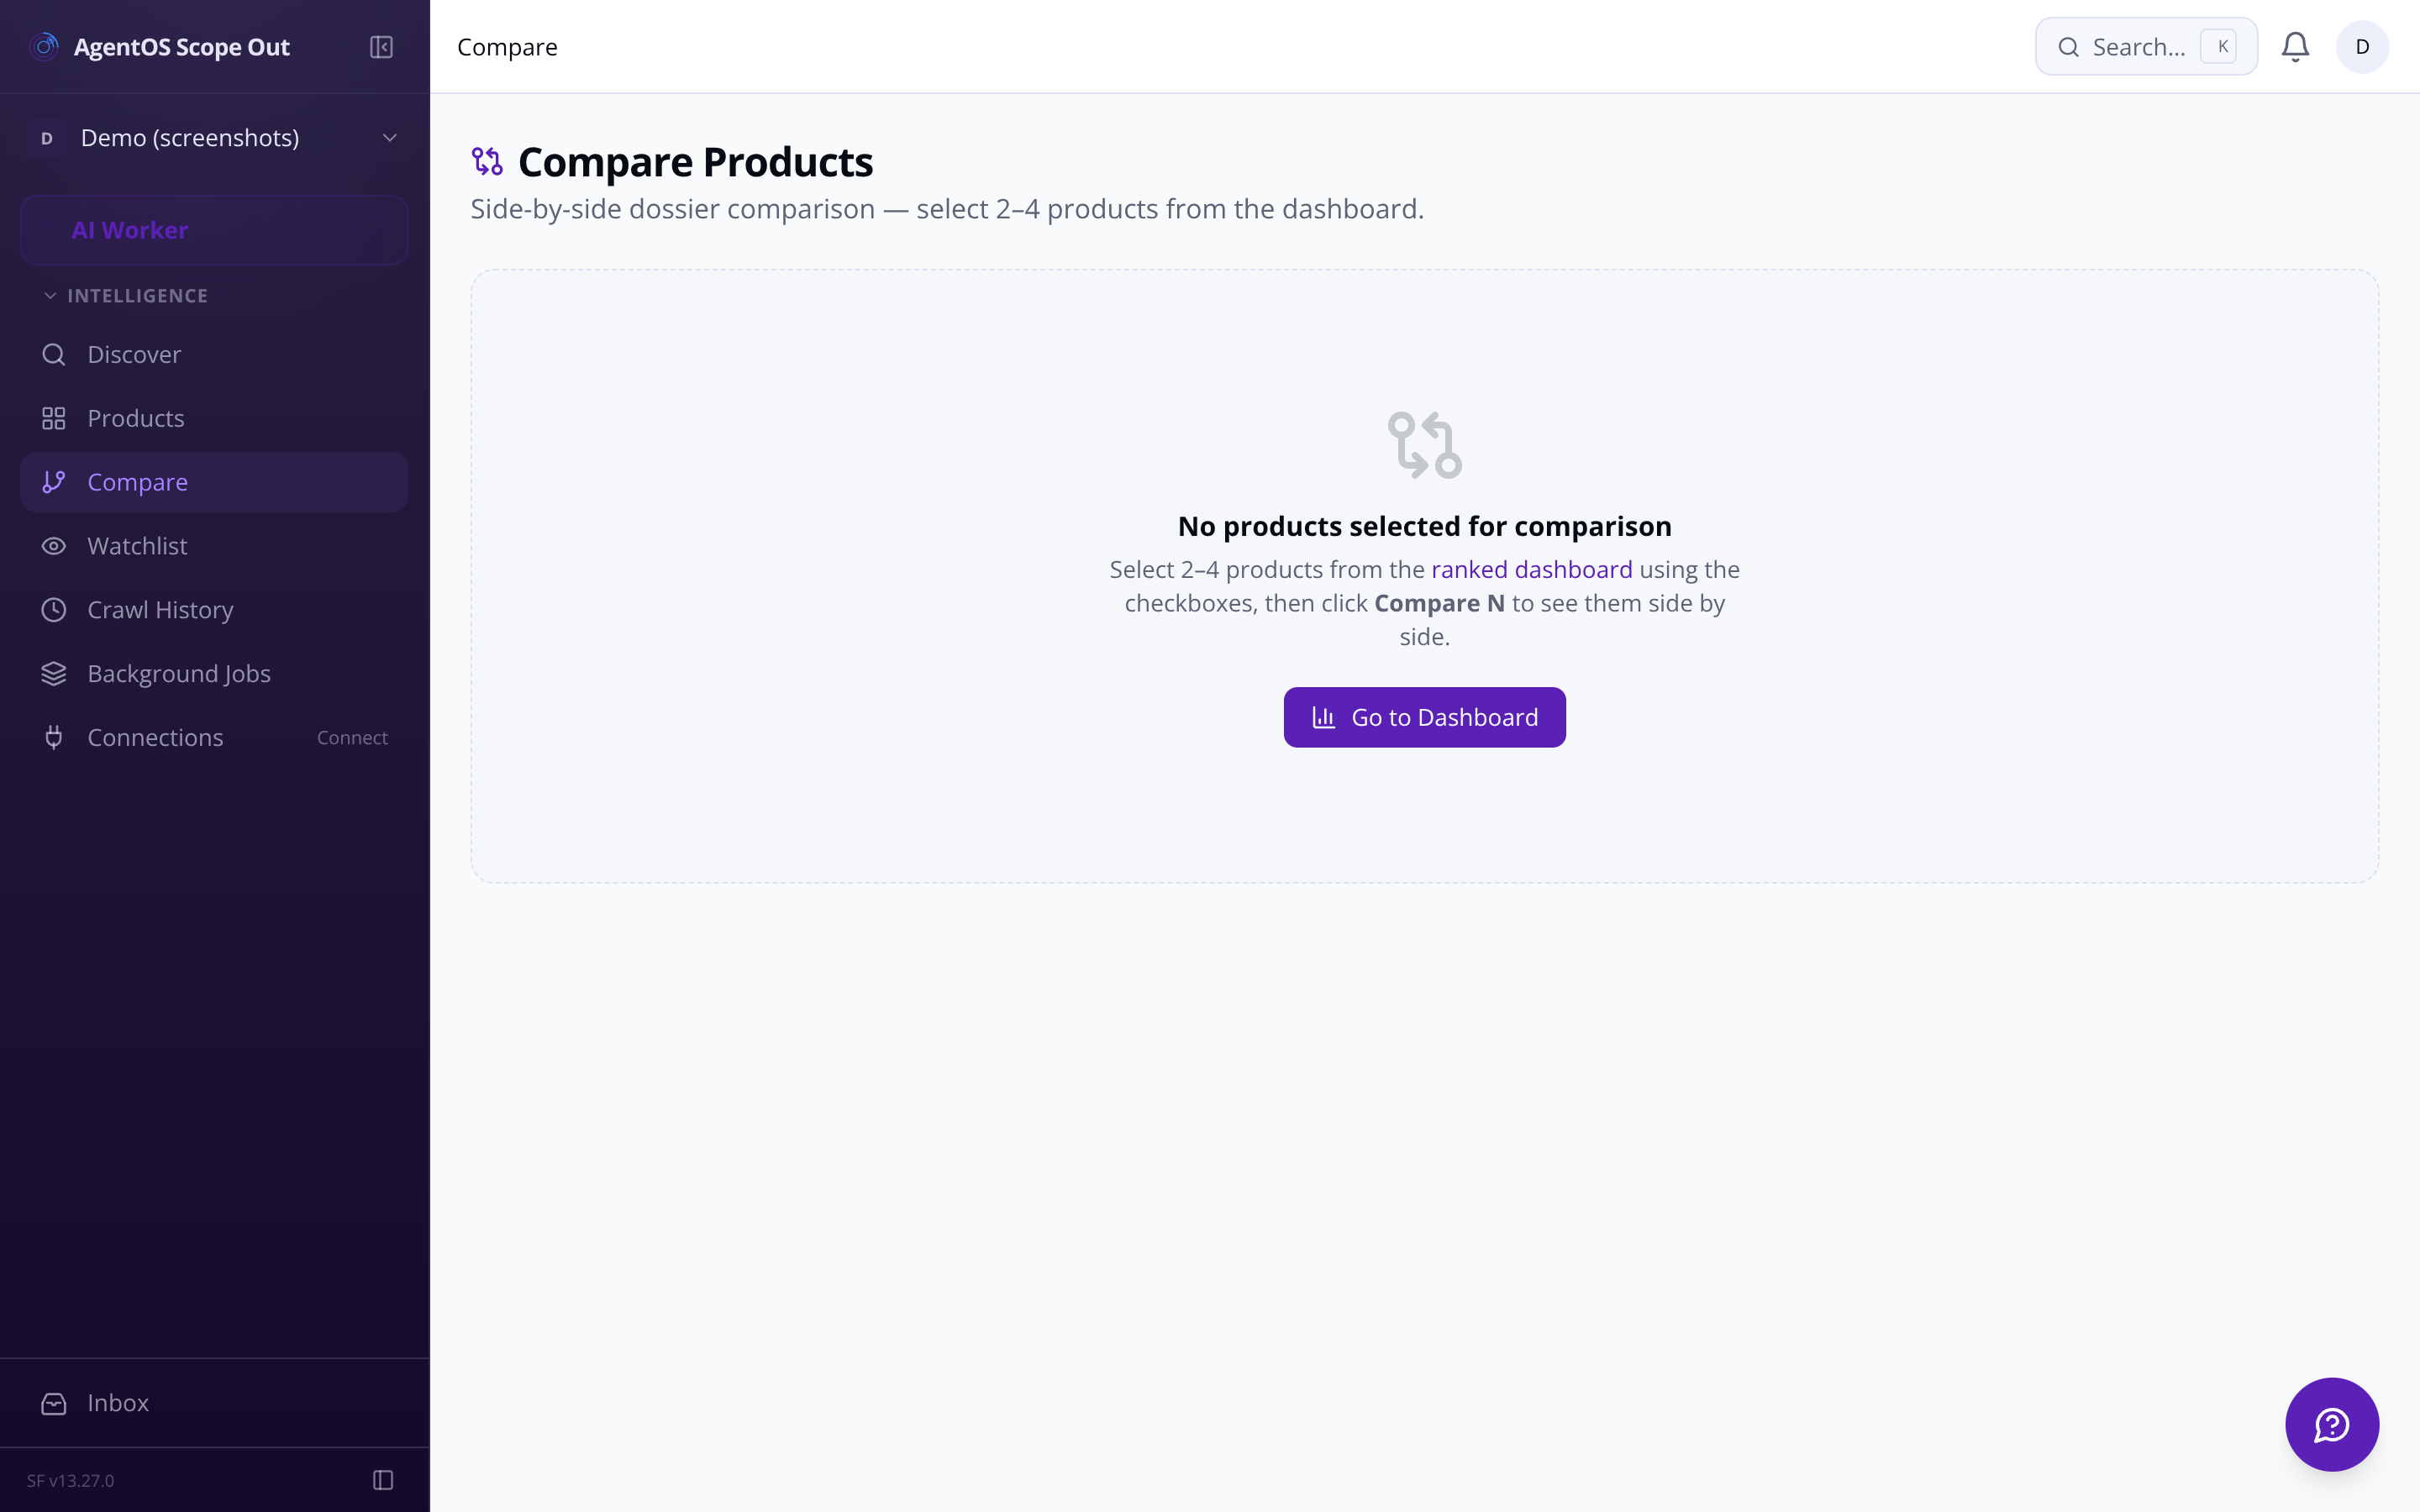
When two products score similarly, the comparison view makes the difference legible. All four dimension scores, pricing tier, review count, and key weakness themes appear in aligned columns — so the decision is data-driven, not instinct-driven.
The crawl, scrape, score, and dossier-generation jobs all run as Inngest background functions — meaning they survive server restarts, handle retries automatically, and are individually inspectable.
Crawl history Every run is logged: directory URL, timestamp, products discovered, products scored, duration, and status. Click a past run to see exactly what it found.
Bulk re-analysis Select up to 50 products and trigger a fresh scrape-and-score batch in one action — useful after you tweak scoring weights.
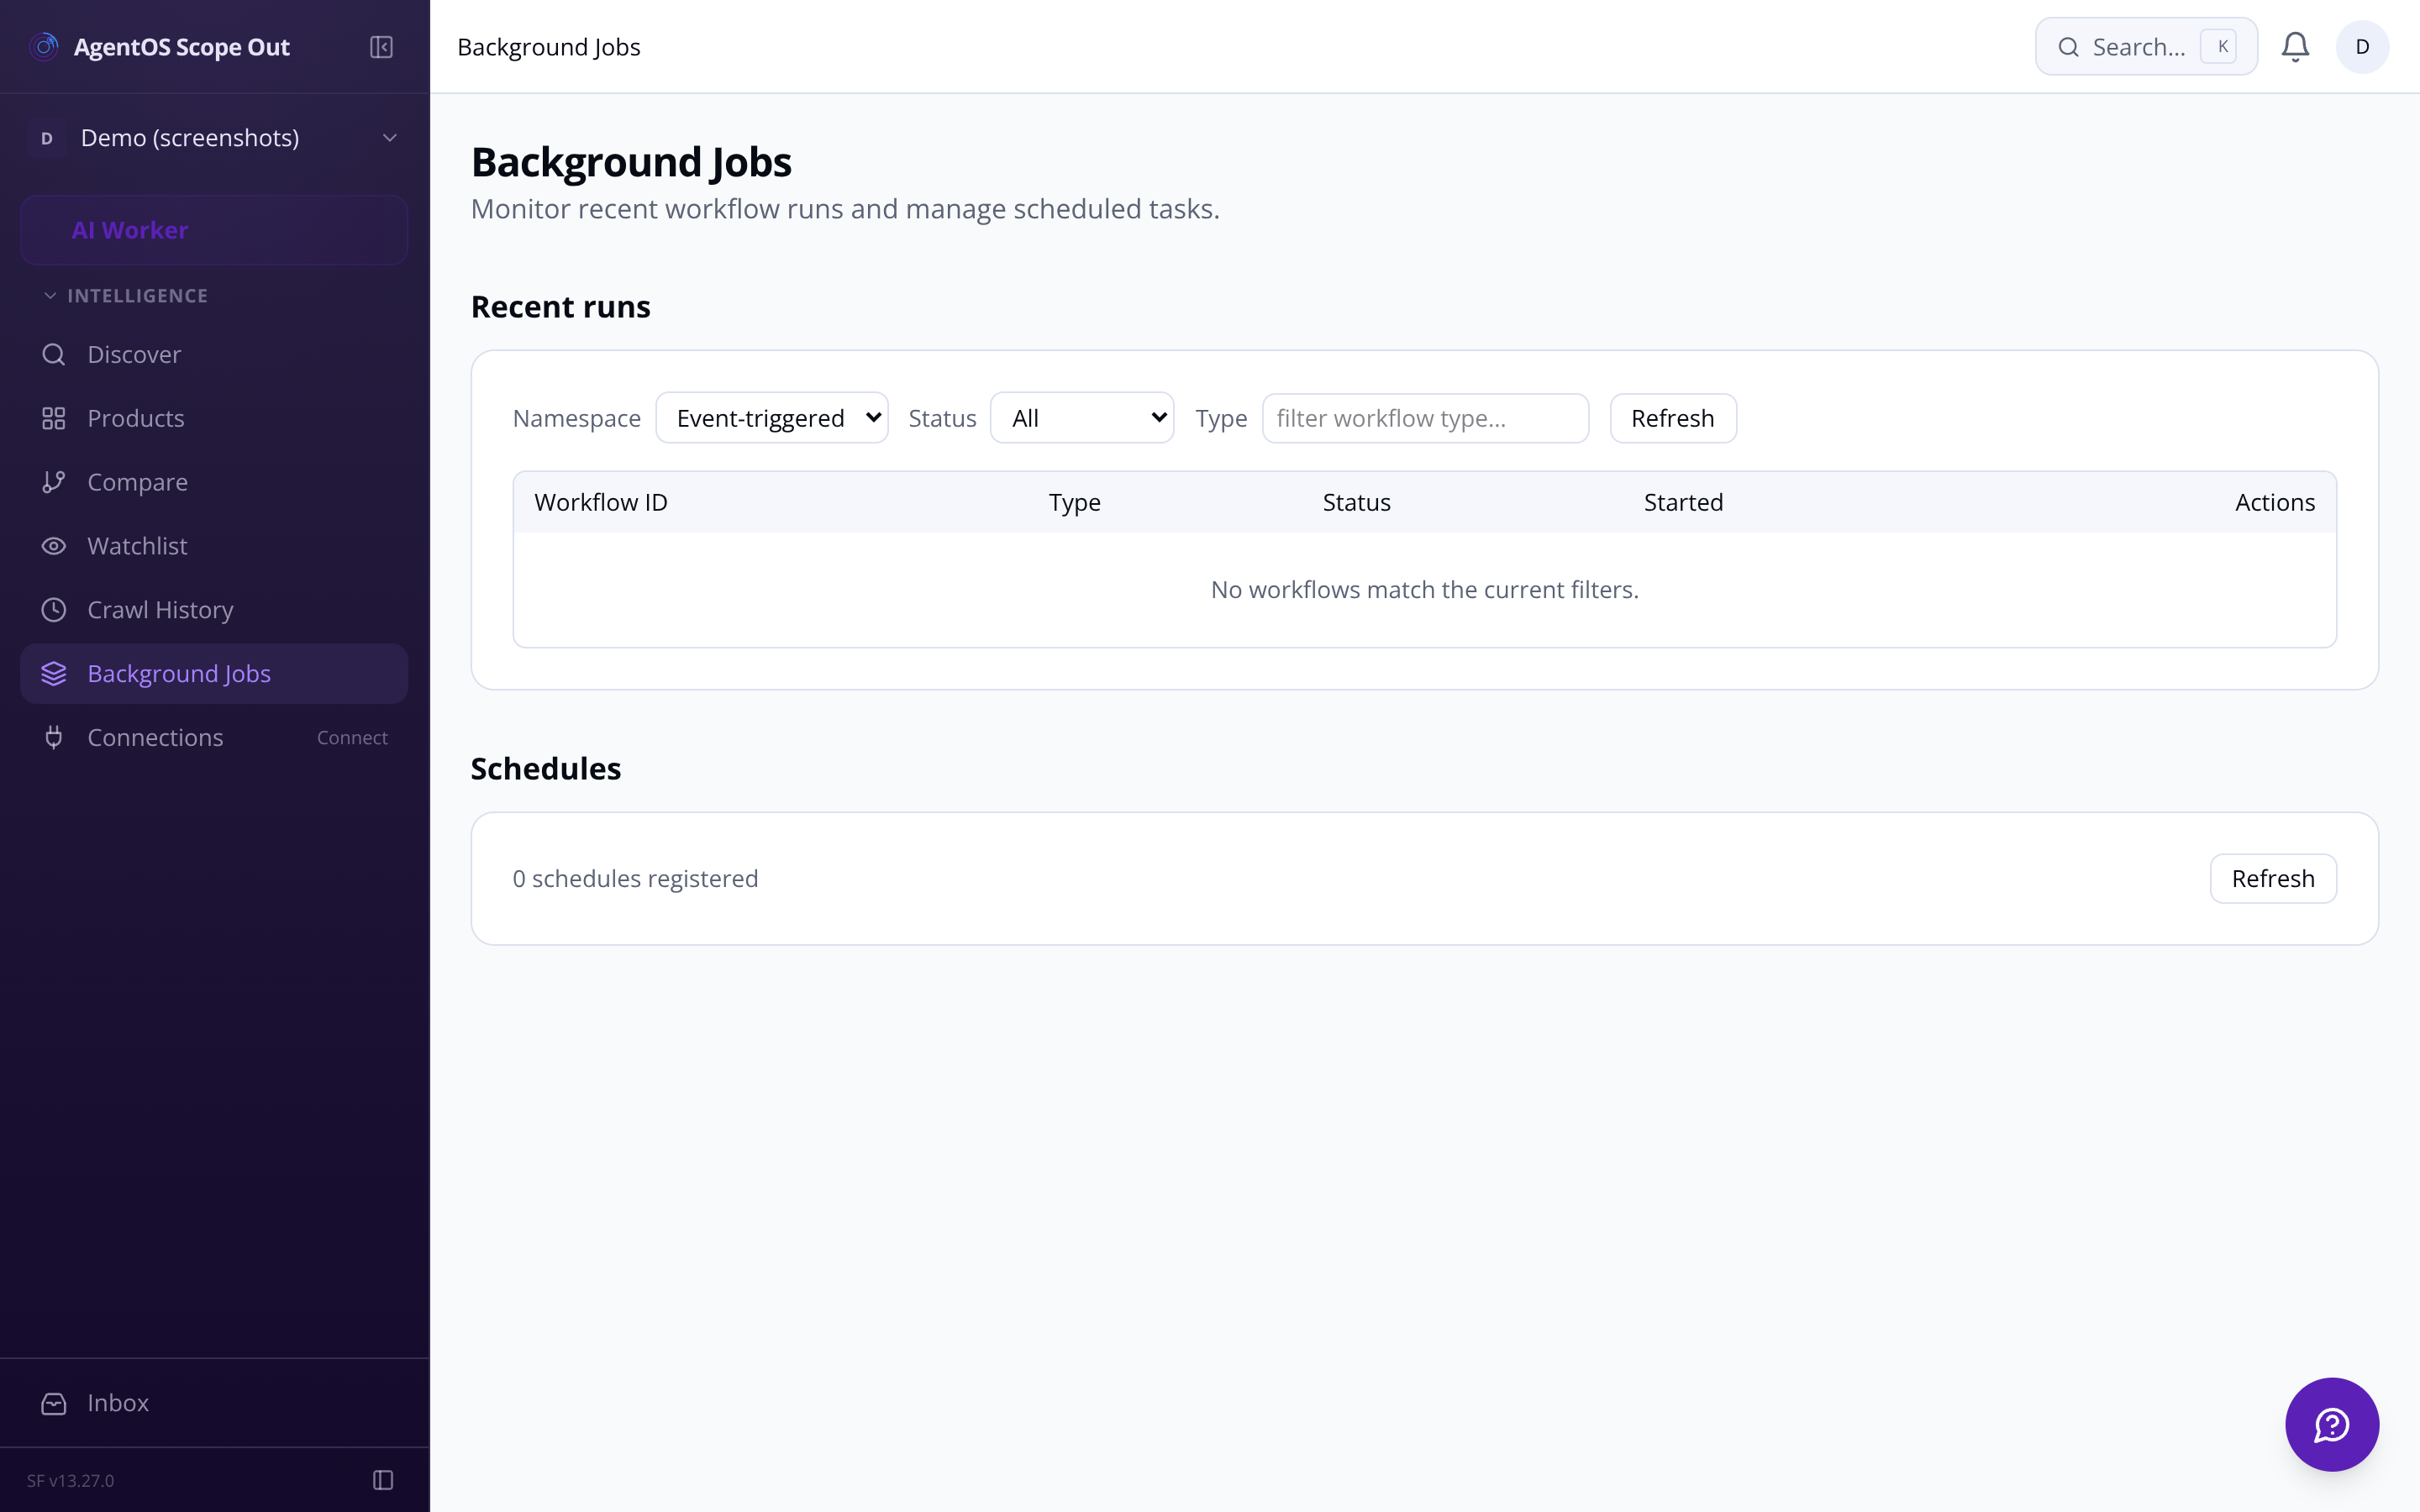
Scheduled monitoring Mark a directory as monitored and a weekly cron re-crawls it automatically. New products get a 'new since last crawl' badge and an in-app notification.
Skim first, commit later Run a quick skim to see how many listings a directory holds before launching a full deep-analysis run.
Auto-flagging The top 20 products by surface signal (review count + pricing tier) are automatically queued for deep analysis — you confirm before the heavy scrape starts.
Retry failed scrapes Products blocked by a 403 or timeout show a clear error state with one-click retry — no silent failures.
AI cost visibility Token usage and estimated OpenAI cost per run are shown on the run detail page so nothing surprises you.
Compare up to four products side-by-side Select any 2–4 rows and open the comparison view — all four dimensions aligned in columns.
Status lifecycle Mark products as reviewed, shortlisted, building, or archived. Shortlisted items live in a dedicated Watchlist tab.
Weekly digest email A Monday digest emails the top 5 new products discovered that week and any significant score movements to the team.